

- All Posts
- Become Partner
- Broker Review
- Crypto
- IPO
- Mutual Fund
- Recent News
- Recent Updates
- Stock Market

January 2, 2026/
No Comments
Best Share Broker for Beginners in India (Low Brokerage & Easy App) Starting your stock market journey can feel overwhelming...

December 31, 2025/
Why Most Traders Lose Money in the Stock Market (And How You Can Avoid It) Many people enter the stock...

December 31, 2025/
How to Choose the Right Share Broker for Successful Trading Choosing the right share broker is one of the most...

December 30, 2025/
Best Share Broker in India for Beginners Entering the Indian stock market as a beginner can feel overwhelming — with...
December 30, 2025/
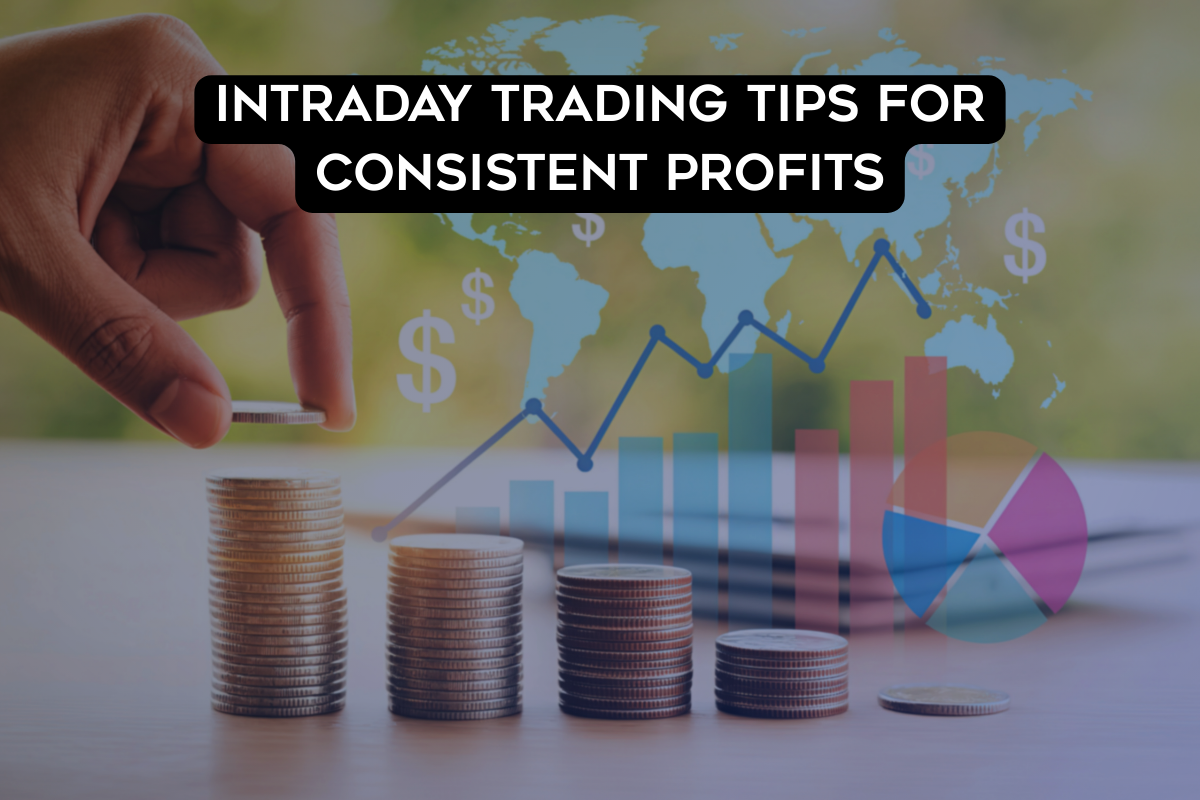
Intraday Trading Tips for Consistent Profits Intraday trading attracts many traders because of its potential for quick profits. However, without...

October 17, 2025/
Latest Grey Market Premium, Subscription & Listing Update The Midwest IPO GMP today continues to reflect strong investor sentiment as...
Motilal Oswal
Zerodha
AngelOne
Profit mart
ProStocks
Upstox
Paytm Money